Nonlinear PCANonlinear PCA toolbox for MATLABby Matthias Scholz |
 for Nonlinear PCA (NLPCA)")
Auto-associative neural network (Autoencoder) |
Nonlinear principal component analysis (NLPCA)
is commonly seen as a nonlinear generalization of standard
principal component analysis (PCA).
It generalizes the principal components from straight lines to curves (nonlinear).
Thus, the subspace in the original data space which is described by all nonlinear components is also curved.
Nonlinear PCA can be achieved by using a neural network with an autoassociative architecture
also known as autoencoder, replicator network, bottleneck or sandglass type network.
Such autoassociative neural network is a multi-layer perceptron that performs an identity
mapping, meaning that the output of the network is required to be identical to the input.
However, in the middle of the network is a layer that works as a bottleneck in which
a reduction of the dimension of the data is enforced. This bottleneck-layer provides
the desired component values (scores).
linear PCA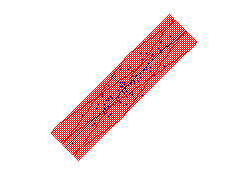
|
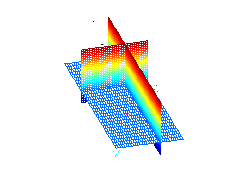
The left plot shows standard PCA applied to a simple two-dimensional data set. The two resulting components are plotted as a grid which illustrates the linear PCA transformation. The plot on the right shows nonlinear PCA (autoencoder neural network) applied to a 3/4 circle with noise. Again, the two components are plotted as a grid, but the components are curved which illustrates the nonlinear transformation of NLPCA. |
nonlinear PCA
|
|
|

|
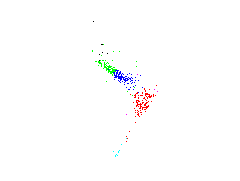
Here, NLPCA is applied to 19-dimensional spectral data representing equivalent widths of 19 absorption lines of 487 stars, available at www.cida.ve. The figure in the middle shows a visualisation of the data by using the first three components of standard PCA. Data of different colors belong to different spectral groups of stars. The first three components of linear PCA and of NLPCA are represented by grids in the left and right figure, respectively. Each grid represents the two-dimensional subspace given by two components while the third one is set to zero. Thus, the grids represent the new coordinate system of the transformation. In contrast to linear PCA (left) which does not describe the nonlinear characteristics of the data, NLPCA gives a nonlinear (curved) description of the data, shown on the right.
Publications by Matthias Scholz
-
Validation of nonlinear PCA.
Matthias Scholz
Neural Processing Letters, Volume 36, Number 1, Pages 21-30, 2012.
[ pdf (pre-print) | pdf (Neural Process Lett) | poster RECOMB 2012 | Matlab code] -
Nonlinear principal component analysis: neural network models and applications.
Matthias Scholz, Martin Fraunholz, and Joachim Selbig.
In Principal Manifolds for Data Visualization and Dimension Reduction, edited by Alexander N. Gorban, Balázs Kégl, Donald C. Wunsch, and Andrei Zinovyev. Volume 58 of LNCSE, pages 44-67. Springer Berlin Heidelberg, 2007.
[ pdf (all book chapters) | pdf (Springer) | entire book (Springer) ] -
Analysing periodic phenomena by circular PCA.
Matthias Scholz.
In S. Hochreiter and R. Wagner, editors, Proceedings of the Conference on Bioinformatics Research and Development BIRD'07, LNCS/LNBI Vol. 4414, pages 38-47. Springer-Verlag Berlin Heidelberg, 2007.
[ pdf (Springer) | pdf (author version) | bibtex ] -
Approaches to analyse and interpret biological profile data.
Matthias Scholz.
University of Potsdam, Germany. Ph.D. thesis. 2006.
URN: urn:nbn:de: kobv:517-opus-7839
URL: http://opus.kobv.de/ubp /volltexte/2006/783/
[ pdf (library) | pdf (copy) | figures ] -
Non-linear PCA: a missing data approach.
Matthias Scholz, Fatma Kaplan, Charles L. Guy, Joachim Kopka, and Joachim Selbig.
Bioinformatics 21(20):3887-3895. 2005.
[ pdf | Advance Access manuscript ] -
Nonlinear PCA based on neural networks.
Matthias Scholz.
Dep. of Computer Science, Humboldt-University Berlin. Diploma Thesis. 2002. In German.
URN: urn:nbn:de:kobv:11-10086728
[ pdf (library) | pdf (pre-print version) -
Nonlinear PCA: a new hierarchical approach.
Matthias Scholz and Ricardo Vigário.
In M. Verleysen, editor, Proceedings ESANN. 2002.
[ pdf (pre-print version) | pdf (ESANN) ]
see all publications: [Matthias Scholz: publications]
Related algorithms
- LLE - Locally Linear Embedding (Sam T. Roweis and Lawrence K. Saul, 2000)
- Isomap (Josh Tenenbaum et al., 2000)
- SOM - Self-Organizing Map (Teuvo Kohonen, 1982)
- Principal Curves (Trevor Hastie and Werner Stuetzle, 1989), Matlab code by Jakob J. Verbeek
- Kernel PCA (Schölkopf et al., 1998)
- NFA - Nonlinear Factor Analysis (Harri Valpola and Antti Honkela, 2000)